Debug Your Plugin
It's important in development phase to see what's happening and where it's happening. You might want to debug the execution of code, watch the values of variables, inspect the data...etc.
Attach Debugger
You'll need a debug build of MonoBleedingEdge runtime to replace the Elin's packaged release version.
Recompiled for Unity 2021.3.45f1-mbe, use this for Elin 23.210 Nightly and after.
Backup First
Before replacing Elin\MonoBleedingEdge\EmbedRuntime\mono-2.0-bdwgc.dll.
Now you can attach a debugger to Elin at 127.0.0.1:55555, example with Rider: 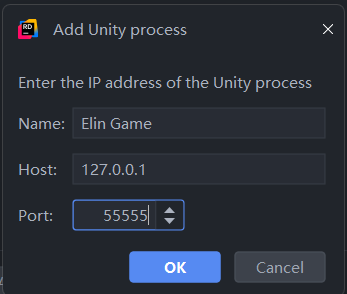
You may set breakpoints on your plugin code and step into/over each line. It's recommended to start the debugger before launching Elin so you can hit the early breakpoints(if any). 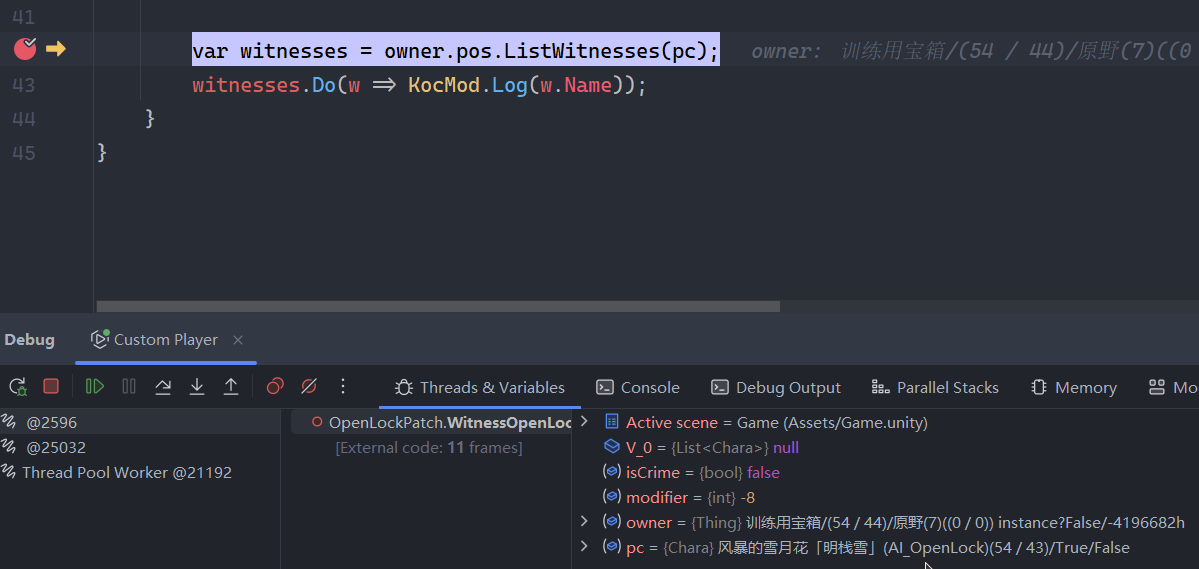
Build Configuration
Your plugin needs to be built with Debug configuration and with full PDB(by default).
Unity Explorer
By using Unity Explorer, you can inspect/modify all C# instances(including Unity Objects) at runtime.
Manual Logging
One of the most common ways of debugging. It's like driving a bumper car.
When you make a BepInPlugin, it comes with a default Logger that writes to both Player.log and BepInEx console. To expose the Logger to the entire plugin scope to access, you can do so with an static method:
[BepInPlugin(ModInfo.Guid, ModInfo.Name, ModInfo.Version)]
internal class MyElinMod : BaseUnityPlugin
{
    internal static MyElinMod? Instance { get; private set; }

    private void Awake()
    {
        Instance = this;

        Log("My mod...loaded?!")
    }

    internal static void Log(object payload)
    {
        Instance!.Logger.LogInfo(payload);
    }
}Simple logging helper that allows you to log anywhere in the project, which will write to BepInEx console and Player.Log.
MyElinMod.Log($"This is {114}th attempts!");An alternative to the BepInPlugin.Logger is Debug.Log from Unity, which writes log strings to the Player.log without any prefix.